I have written an article about the similarities between now and the great depression, which I will post at a later date. However, for now, I just noticed another interesting parallel.
One of the reasons the GD was so bad was that, while the natural course of events should have caused price deflation, and this happened in spades in monetary terms, the authorities did all they could to prevent prices falling. While the fall in the money supply was not itself the problem (it simply was the necessary consequence of the credit boom and was in no way a cause of the crisis), the way the authorities tried to prevent prices themselves falling in spite of a lower money supply, was the source of much of the unnecessary damage.
By artificially propping up wages, commodity prices, and consumer prices, the government failed to let markets clear (particularly the labour market), prevented the reorganisation of labour and capital, and retarded the rise in the savings rate. Today, we have a similar situation. I’m not talking about the minimum wage. I’m talking about the policies to kill the dollar and encourage the dollar carry trade. By artificially elevating commodity prices, this is squeezing disposable income and reducing the ability of consumers and businesses to save. What’s more, the uncertainty over the outlook for prices (there is a range of possibilities from crushing deflation to hyperinflation) is no doubt hindering investment decisions as did the interventionist policies of the 1930s.
The fundamentals of the US economy continue to deteriorate, positive real GDP growth or no.
Tuesday 10 November 2009
Tuesday 3 November 2009
Dow 3,000 On Its Way
Everything I look at tells me the bear-market rally in global and emerging market equities is over. Any rallies should be used as an opportunity to get out, or better still, get short.
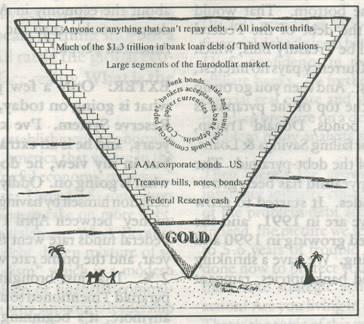
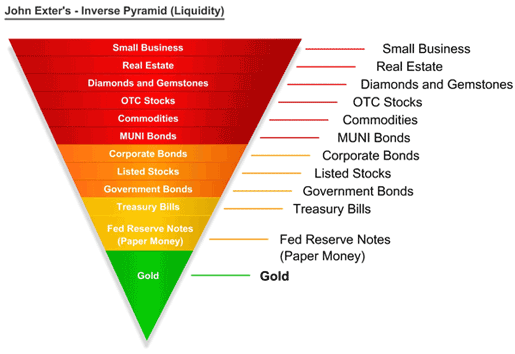
Anyone expecting an economic recovery or even hyperinflation in the US is about to get very confused as we enter the next leg of the US$43trn debt pyramid collapse.

Elliot Wave Confirmation – The Primary wave 2 (P2) bear-market rally appears to have been completed following an ABC correction since March, and a five wave advance since June. We are in the early stages of a primary wave decline at the beginning of a Supercycle bear market. The wave 3 decline will be at least as big as the wave 1 collapse seen in 2008, and as Robert Prechter states ‘third waves are wonders to behold’.
The EW pattern is even clearer in emerging market stocks, with the MSCI Emerging Market etf (EEM) having been rejected at the 61.8% retracement level– the hallmark of P2 bear-market rally.
Panic-Driven Gap Filled – The gap in the S&P at 1,100, created at the height of fear in October, has now been filled. As the chart shows, this was the case in 1930 when the bear-market rally in the Dow topped.

Volume Is Picking Up – After 7 months of declining volume, September marked 1st sequential month of rising volume. Again, this is consistent with the beginning of a third wave.
The Fear Gauge Is Back Up – following several months of sailing through the eye of the storm, the VIX has burst through support signalling the end of the low-vol fuelled carry trade. This is perfectly consistent with the beginning of a P3 decline.
Dow Theory – While the Dow made new highs in September, the Dow Transports failed to confirm this, and despite today’s Warren Buffet-fuelled rally, the uptrend is no longer in place.
Market Breadth – The sell-off has not been confined to a few indices. Everything from the Brazilian Bovespa to the New Zealand dollar look like they are past their peak.
Optimism Is At A Peak – Consistent with a market top, hope and optimism are at a peak. The trailing PE ratio is at an ALL TIME HIGH, and analysts are pricing in a perfect recovery in earnings.

Sentiment – try telling someone you are bullish on the dollar and see if they don’t look at you like you are mental. With sentiment so heavily skewed in favour of the reflation trade, there is simply not enough profit to reward all these people with the same outlook. This makes for a sharp and sustained reversal.
The Fundamentals
Despite the US economy supposedly growing in Q309, it is undoubtedly in worse shape: Thanks to the government’s ill-advised Keynesian policies, private consumption has actually risen as a proportion of GDP; Federal debt (involuntary and unproductive private debt) is much higher; Structural unemployment is higher; the Chinese economy has gone from being in a position to mount a long-term sustainable recovery to help drive global growth to the verge of a banking sector crisis. What is more, the Fed, who got us into this mess, has gained more control over the economy. In sum, the imbalances that caused the crisis have grown larger.
Deflationary Depression Just Begun
While the recession may be officially over, the depression is only just beginning. This is a once in a lifetime credit contraction. While I can see where inflationists like Peter Schiff, Jim Rogers, and Marc Faber are coming from, I think they are barking up the wrong tree. While they are likely to be proven correct eventually (the fiscal deficits and foreign central bank reserve diversification will catch up down the line), that’s no consolation for being wrong now. After all, timing is the difference between salad and garbage.

The above chart shows the extent of the credit excess seen over the last Supercycle, and almost guarantees that we are facing deflation and not inflation. We live in a credit money system, not a fiat money system. The banking system creates the vast majority of money in our economy, not the government – the conventional money multiplier model implies the tail wags the dog. No matter how much money sits on reserves at the Fed, if the banks don’t want to lend, and consumer don’t want to borrow, this money might as well simply not exists. For the hyperinflation threat to play out, the Fed would need to create cash to the tune of $43trn in order to replace our debt-based system with a fiat based system. Those looking for hyperinflation should be aware of this.
So there you have it: Technicals, Sentiment, and Fundamentals. The coming wave down will be epic.
Anyone expecting an economic recovery or even hyperinflation in the US is about to get very confused as we enter the next leg of the US$43trn debt pyramid collapse.
Elliot Wave Confirmation – The Primary wave 2 (P2) bear-market rally appears to have been completed following an ABC correction since March, and a five wave advance since June. We are in the early stages of a primary wave decline at the beginning of a Supercycle bear market. The wave 3 decline will be at least as big as the wave 1 collapse seen in 2008, and as Robert Prechter states ‘third waves are wonders to behold’.
The EW pattern is even clearer in emerging market stocks, with the MSCI Emerging Market etf (EEM) having been rejected at the 61.8% retracement level– the hallmark of P2 bear-market rally.
Panic-Driven Gap Filled – The gap in the S&P at 1,100, created at the height of fear in October, has now been filled. As the chart shows, this was the case in 1930 when the bear-market rally in the Dow topped.
Volume Is Picking Up – After 7 months of declining volume, September marked 1st sequential month of rising volume. Again, this is consistent with the beginning of a third wave.
The Fear Gauge Is Back Up – following several months of sailing through the eye of the storm, the VIX has burst through support signalling the end of the low-vol fuelled carry trade. This is perfectly consistent with the beginning of a P3 decline.
Dow Theory – While the Dow made new highs in September, the Dow Transports failed to confirm this, and despite today’s Warren Buffet-fuelled rally, the uptrend is no longer in place.
Market Breadth – The sell-off has not been confined to a few indices. Everything from the Brazilian Bovespa to the New Zealand dollar look like they are past their peak.
Optimism Is At A Peak – Consistent with a market top, hope and optimism are at a peak. The trailing PE ratio is at an ALL TIME HIGH, and analysts are pricing in a perfect recovery in earnings.
Sentiment – try telling someone you are bullish on the dollar and see if they don’t look at you like you are mental. With sentiment so heavily skewed in favour of the reflation trade, there is simply not enough profit to reward all these people with the same outlook. This makes for a sharp and sustained reversal.
The Fundamentals
Despite the US economy supposedly growing in Q309, it is undoubtedly in worse shape: Thanks to the government’s ill-advised Keynesian policies, private consumption has actually risen as a proportion of GDP; Federal debt (involuntary and unproductive private debt) is much higher; Structural unemployment is higher; the Chinese economy has gone from being in a position to mount a long-term sustainable recovery to help drive global growth to the verge of a banking sector crisis. What is more, the Fed, who got us into this mess, has gained more control over the economy. In sum, the imbalances that caused the crisis have grown larger.
Deflationary Depression Just Begun
While the recession may be officially over, the depression is only just beginning. This is a once in a lifetime credit contraction. While I can see where inflationists like Peter Schiff, Jim Rogers, and Marc Faber are coming from, I think they are barking up the wrong tree. While they are likely to be proven correct eventually (the fiscal deficits and foreign central bank reserve diversification will catch up down the line), that’s no consolation for being wrong now. After all, timing is the difference between salad and garbage.
The above chart shows the extent of the credit excess seen over the last Supercycle, and almost guarantees that we are facing deflation and not inflation. We live in a credit money system, not a fiat money system. The banking system creates the vast majority of money in our economy, not the government – the conventional money multiplier model implies the tail wags the dog. No matter how much money sits on reserves at the Fed, if the banks don’t want to lend, and consumer don’t want to borrow, this money might as well simply not exists. For the hyperinflation threat to play out, the Fed would need to create cash to the tune of $43trn in order to replace our debt-based system with a fiat based system. Those looking for hyperinflation should be aware of this.
So there you have it: Technicals, Sentiment, and Fundamentals. The coming wave down will be epic.
Wednesday 21 October 2009
Debt-Deflation Still In Play
What will be the main trend in US equity markets and the dollar over the next 6 months?
1) Dollar Strength & Equity Strength. Probability: 1%
2) Dollar Weakness & Equity Strength. Probability: 13%
3) Dollar Weakness & Equity Weakness. Probability: 16%
4) Dollar Strength & Equity Weakness. Probability: 70%
Picking the correct number will be key to determining whether you make or loose money over the next six months. Below I give a brief summary of why I have assigned the respective probabilities. As you’ll see, whichever way you slice it, my outlook is grim, but a stronger dollar and weaker equities is my pick.
1) Dollar Strength & Equity Strength. We are currently in the early stages of a depression. This is just a plain fact. What is needed for the dollar to strengthen and stocks to rise in this depression, in spite of dollar strength, is a massive increase in the current rate of return on assets, which sees a return of capital back to the US. In the absence of rising financial leverage (unlikely due to the state of the banking sector) and with lower consumer spending guaranteed, this would require an almost impossible rise in productivity. Something akin to the dot.com boom cannot be entirely ruled out, however. 1%
2) Dollar Weakness & Equity Strength. This basically calls for a continuation of the current trend. Hyperinflation would certainly be consistent with this view, but it seems unlikely. What is slightly more likely is a steady decline in the dollar coupled with a continued rise in risk appetite backed up by improving US economic fundamentals, which all serve to prolong the current bubble. While this would not be sustainable, over a six month horizon it is certainly possible for it to continue. 12%
3) Dollar Weakness & Equity Weakness. This more realistic. The reasons to expect dollar weakness are all-too obvious, and while we have seen dollar weakness translate into equity strength in recent months this need not continue. In fact, as I write this post, the Dow is falling hard while the dollar is still weak (the Dow is getting KILLED in Aussie dollar terms, and the long-term downtrend is still in place). If emerging market demand for commodities remains strong and the Chinese revalue the yuan, commodities prices could rise substantially, squeezing companies’ top line growth and raising costs. While I don’t want to read to much into daily moves, I think it is significant that the Dow Transports rolled over today (not confirming the break-out according to Dow Theory) as oil spiked higher. While I would expect this trend to be short-lived, the period from H207 to H108 showed this relationship can go on for a long time.
4) Dollar Strength & Equity Weakness. This is my core view. True, I have held this view since Dow 9,000 and EUR1.4000/US$, but with the Dow now at 10,000 and the euro at EUR1.5000/US$, and the fundamentals unchanged, I like it even more. After all, the idea is to buy low and sell high is it not? I find it strange that people are jumping into the Dow now when they didn’t want any of it at 7,000, and are scrambling out of dollars when they couldn’t get enough of them at EUR1.3000/US$ a year ago.
Do you remember 12 months ago when the prevailing wisdom was that no matter what the government/Fed did to crush the dollar (and everyone new that’s what they were going to try and do), private sector deleveraging would ensure that the dollar continued to strengthen and asset prices continued to fall? If I had told you then that in less than a year’s time the Argentine Merval stock index would be pushing all-time highs, or that the AUD would be heading for parity against the dollar I’m pretty sure I would have been laughed at. Of course, I didn’t say those things. I was part of the consensus that thought the Fed could not overwhelm the natural deflationary pressures at play, and that the trend of deflation would continue. As far as I could see the Fed was just ‘pushing on a string’.
But my point is that the market works by exerting the maximum amount of pain on the maximum amount of people, and the thing that the fewest people expect is the thing that invariably happens. What if in 6 months time the DXY was back at the early-2009 highs? What if the Dow was below 6,500? What if the Fed indeed turned out to be impotent and a wave of private sector deleveraging overwhelmed their re-flation efforts? What if the rally since March turned out to have been driven by a temporary rise in optimism that was merely encouraged by the Fed? What if this has just been a bear-market rally within a longer-term debt-deflation spiral and the continued evaporation of the global debt pyramid?
Monday 19 October 2009
PBOC Backing Itself Into A Corner
While the Chinese Composite may be lagging in this global equity market frenzy, Chinese economic data is certainly fuelling it. Last week’s monetary data from the PBOC confirmed the willingness of Chinese policymakers to throw all they can at the economy in a bid prolong the current economic boom they are borrowing from the future.

M2 money supply grew by 29.3% y-o-y in September, up from 28.4% in August, and new loans rose to CNY516.7bn (see chart above). This is a truly shocking rate of monetary expansion, and unless the laws of economics have changed, it is fostering a bubble that could jeopardise China’s long-term growth story.
V-Shaped Recovery, But At What Price?
True, the economy is growing rapidly at present as a direct result of this wave of liquidity. Recent import data and figures for electricity consumption (which rose 10.2% y-o-y in September according to the China Electricity Council) suggest a V-shaped recovery is well underway. However, loose monetary policy is exacerbating the current imbalance between consumption and production, while fuelling a destructive asset bubble. This is because new money is being directed overwhelmingly towards investment spending and speculation rather than consumption. Also, the future burden of rising non-performing loans in the banking system (resulting from the rise in malinvestment associated with rapid credit expansion) will likely be felt by consumers, who will be forced to accept a higher loans-deposits spread to recapitalise the banking sector.
Addicted To Credit
This puts the PBOC in a tight spot to say the least. In order for monetary policy to continue to support the real economy, credit growth will have to accelerate. A moderation in the rate of credit expansion, as Hayek explained, will result in recessionary symptoms. A slowdown would thus jeopardise the entire Asian and global economic recovery. On the other hand, an acceleration of credit growth would further fuel the unsustainable bubble, deepen the consumption-investment imbalance, and sow the seeds for an economic and financial crisis.
The Chinese government appears to be banking on a timely recovery in global demand that would allow exports to pick up the slack as it cools investment spending next year. However, global demand of the kind seen 18 months ago is not coming back. The only reason Chinese exports are currently rebounding is because Chinese imports are temporarily boosting the economies of its main trading partners. Once China itself begins to apply the brakes, there will be no driver of demand to soak up the increased supply. What the government needs to do is bite the bullet and take the recession that is due. This is the only way that the economy will be able to reorganise itself into a sustainable production model. At present, though, this seems highly unlikely.
Sunday 11 October 2009
What's Behind The Stock Market Rally?

The above is a chart I found over at Jesse's Cafe Americain, a good blog. It shows how the current equity rally is been dirven by monetary inflation that is not finding its way to the real economy, but to asset markets. As a result, the S&P500earnings multiple has risen to the highest level ever. I suppose if you can have a 'jobless economic recovery' you can easily have an 'earningsless bull market'.
Saturday 10 October 2009
Australia: Hiking Rates… But For What Reason?
The Reserve Bank of Australia (RBA) hiked interest rates on Tuesday, from 3.00% to 3.25%, in what appears to have marked the first act of monetary tightening since the 25 basis point hike by the ECB back in August 2008.
I salute the RBA. Unlike the rest of the global central banking community, it has shown an ability and a willingness to act pre-emptively to tame asset price inflation. Rather than sit idly by and watch house prices soar to bubble levels and deal with the subsequent bust, it has been pro-active, and this prudence should underpin the currency and lay the foundations for sustainable economic recovery.
HOWEVER, the key question is why did the RBA hike? If the RBA acknowledges that higher interest rates will encourage savings and prevent another asset price bubble, and is willing to bite the bullet and sacrifice near-term growth to avoid this fate, then well played indeed. However, if the RBA thinks that the economic slump has passed and growth will accelerate from here, and as such inflation is the larger threat, I fear the worst.
Household debt in Australia is larger than that in the US relative to GDP, and private sector deleveraging has only just begun. If this deleveraging process goes into full swing, the RBA may find that it overestimated Australia’s growth outlook, and move swiftly to reverse the hike, much like the ECB did not so many months ago.
Saturday 3 October 2009
Nikkei: Structural Bear Beats Cyclical Bull
After breaking through support the Japanese Nikkei index looks under serious pressure, with 9,700 the next level to watch. Fundamentally, the economy is a disaster, as weak global demand continues to expose the domestic deflationary stagnation. The recent high of 10,800 looks likely to have marked the cyclical high for Japanese equities, which would mark yet another lower high. A lower low is coming.

There have been a number of factors weighing on the Nikkei in recent days. The unexpected improvement in Japan’s unemployment rate, which fell from 5.7% to 5.5% in August, has been outweighed by a confluence of negative factors. Firstly, the stronger yen, driven partly by Finance Minister Hirohisa Fujii’s comments that a strong currency has generally been good for the economy because it has boosted domestic purchasing power, was a major driver. The poor Tankan survey results, which showed large businesses are aiming to cut spending by 10.8% this year, more than the 9.4% planned three months ago, also hurt market sentiment. The two largest forces weighing on the market, however, which pose a serious threat going forward, were the Chicago PMI data suggesting that the US economy remains in depression, and Japanese CPI data confirming that domestic deflation is deepening.

Export Dependence Remains Key Risk
These two factors sum up the struggles facing the Japanese economy. Starting with the fall in the Chicago PMI, this shatters any hope of a sustainable US andglobal recovery – something which the Japanese economy (and export-sector dependent equity markets), has relied heavily on in recent years to revive it from its deflationary stagnation. With the help of the weak yen (thanks to the carry trade) and strong global demand, the Japanese economy and the Nikkei staged a respectable recovery from 2003 to 2007, with the latter rallying 140% from peak to trough, as exporters lead the way. The current outlook, however, with a strong yen and weak external demand, is far less sanguine.
Deflation Accelerating
With that in mind let me turn your attention to the recent inflation data. As the accompanying charts show, Japan is clearly stuck fast in deflation. Core CPI came in at -2.4% y-o-y in August, the largest fall on record, and the September Tokyo CPI showed a similarly worrying trend. While the year-on-year figure fell by 2.0%, the actual index shows the extent of the deflationary mire that the economy remains in. The price index is the same level now as it was in 1992, and has fallen a staggering 9.5% since the October 1998 high.

Misguided Policies Mean A Slow And Painful Death
As underlying fundamentals of the Japanese economy continue to deteriorate, and deflation continues to trump re-flation efforts, any signal that global demand is waning is likely to weigh heavily on the Japanese economy and asset markets. It was no surprise that the Japanese economy contracted more than any other developed market in Q109 when the pillar of external demand gave way. Indeed, the failure of macroeconomic policies in the wake of the asset price collapse of the 1990s has been partially hidden by the strong export sector, while fostering a climate of mild and protracted deflation. The government has sought to reduce the debt load of the corporate sector and expand that of the public sector to fill the gap in demand. While low interest rates have prevented a debt-deflationary spiral similar to the Great Depression, they have also failed to force about the necessary liquidation of malinvestments created during the bubble era. As such, while public debt has ballooned, corporate debt remains high. The economy is no closer to embarking on a sustainable recovery as the private sector is yet to work off its imbalances and the public sector has created a host of new ones.

Cyclical High Is In
Continued core deflation has been a symptom of the asset bubble bursting, and has come in spite of the inflationary policies pursued by the government. The large liquidity-fuelled cyclical rallies seen in the Nikkei have brought lower highs and lower lows, as the underlying fundamentals have continued to deteriorate. It is looking increasingly likely that the recent high of 10,800 will mark the top of this cyclical (rather than secular) bull market, which could open up much further downside for the index. While continued price deflation – a sign that the economy is trying to heal itself – will help to support real incomes, it is likely to result in further asset price weakness in Japan over the medium term. The sooner this occurs, though, the sooner a sustainable recovery will be enjoyed.
There have been a number of factors weighing on the Nikkei in recent days. The unexpected improvement in Japan’s unemployment rate, which fell from 5.7% to 5.5% in August, has been outweighed by a confluence of negative factors. Firstly, the stronger yen, driven partly by Finance Minister Hirohisa Fujii’s comments that a strong currency has generally been good for the economy because it has boosted domestic purchasing power, was a major driver. The poor Tankan survey results, which showed large businesses are aiming to cut spending by 10.8% this year, more than the 9.4% planned three months ago, also hurt market sentiment. The two largest forces weighing on the market, however, which pose a serious threat going forward, were the Chicago PMI data suggesting that the US economy remains in depression, and Japanese CPI data confirming that domestic deflation is deepening.
Export Dependence Remains Key Risk
These two factors sum up the struggles facing the Japanese economy. Starting with the fall in the Chicago PMI, this shatters any hope of a sustainable US andglobal recovery – something which the Japanese economy (and export-sector dependent equity markets), has relied heavily on in recent years to revive it from its deflationary stagnation. With the help of the weak yen (thanks to the carry trade) and strong global demand, the Japanese economy and the Nikkei staged a respectable recovery from 2003 to 2007, with the latter rallying 140% from peak to trough, as exporters lead the way. The current outlook, however, with a strong yen and weak external demand, is far less sanguine.
Deflation Accelerating
With that in mind let me turn your attention to the recent inflation data. As the accompanying charts show, Japan is clearly stuck fast in deflation. Core CPI came in at -2.4% y-o-y in August, the largest fall on record, and the September Tokyo CPI showed a similarly worrying trend. While the year-on-year figure fell by 2.0%, the actual index shows the extent of the deflationary mire that the economy remains in. The price index is the same level now as it was in 1992, and has fallen a staggering 9.5% since the October 1998 high.
Misguided Policies Mean A Slow And Painful Death
As underlying fundamentals of the Japanese economy continue to deteriorate, and deflation continues to trump re-flation efforts, any signal that global demand is waning is likely to weigh heavily on the Japanese economy and asset markets. It was no surprise that the Japanese economy contracted more than any other developed market in Q109 when the pillar of external demand gave way. Indeed, the failure of macroeconomic policies in the wake of the asset price collapse of the 1990s has been partially hidden by the strong export sector, while fostering a climate of mild and protracted deflation. The government has sought to reduce the debt load of the corporate sector and expand that of the public sector to fill the gap in demand. While low interest rates have prevented a debt-deflationary spiral similar to the Great Depression, they have also failed to force about the necessary liquidation of malinvestments created during the bubble era. As such, while public debt has ballooned, corporate debt remains high. The economy is no closer to embarking on a sustainable recovery as the private sector is yet to work off its imbalances and the public sector has created a host of new ones.
Cyclical High Is In
Continued core deflation has been a symptom of the asset bubble bursting, and has come in spite of the inflationary policies pursued by the government. The large liquidity-fuelled cyclical rallies seen in the Nikkei have brought lower highs and lower lows, as the underlying fundamentals have continued to deteriorate. It is looking increasingly likely that the recent high of 10,800 will mark the top of this cyclical (rather than secular) bull market, which could open up much further downside for the index. While continued price deflation – a sign that the economy is trying to heal itself – will help to support real incomes, it is likely to result in further asset price weakness in Japan over the medium term. The sooner this occurs, though, the sooner a sustainable recovery will be enjoyed.
Subscribe to:
Posts (Atom)